
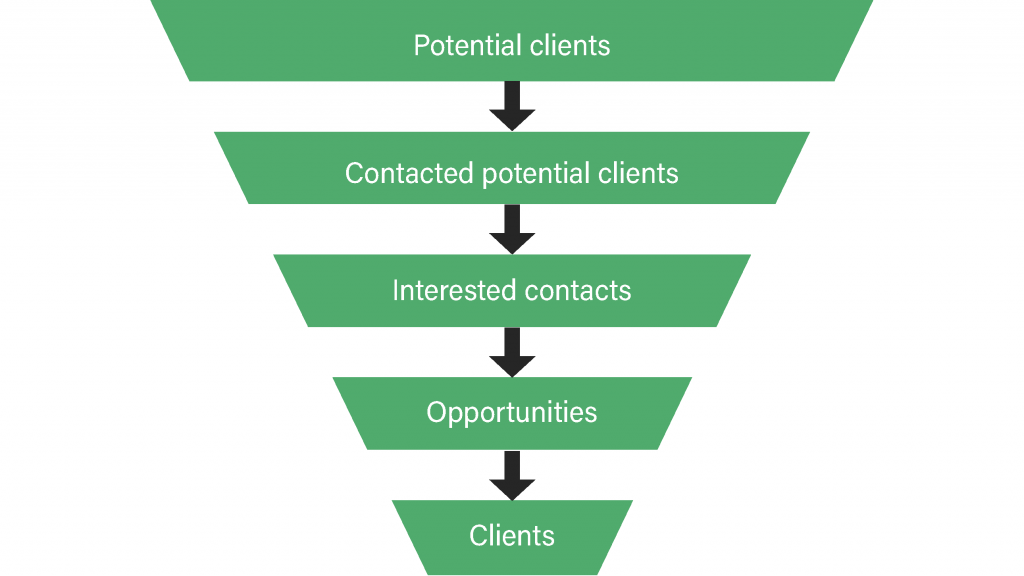
Whoever deals with sales or marketing is familiar with the concept of the sales funnel. It is a visual representation of the four phases that characterize sales negotiation:
- Potential clients – The first phase of the sales process includes a mapping activity of the reference market, during which we identify the first cluster of potential clients.
- Contacted potential clients – the second step of the process focuses on identifying potential clients that are interesting for our business. Starting from the previously classified broad set of potential clients, we select the most interesting ones and conduct a first contact action.
- Interested contacts – The third phase of the process is characterized by activities aimed at identifying qualified contacts that have shown interest in the offered products or services. We, therefore, select those contacts that indicate a need, for example, the resolution of a problem or the improvement of specific KPIs.
- Opportunities – The fourth step of the sales process concerns contacts that have become real commercial opportunities. They are indeed contacts in an advanced commercial stage to whom we have sent an offer or with whom we have had a meeting.
- Clients – the fifth and last phase of the process coincides with customer acquisition.
KPIs for sales funnel analysis
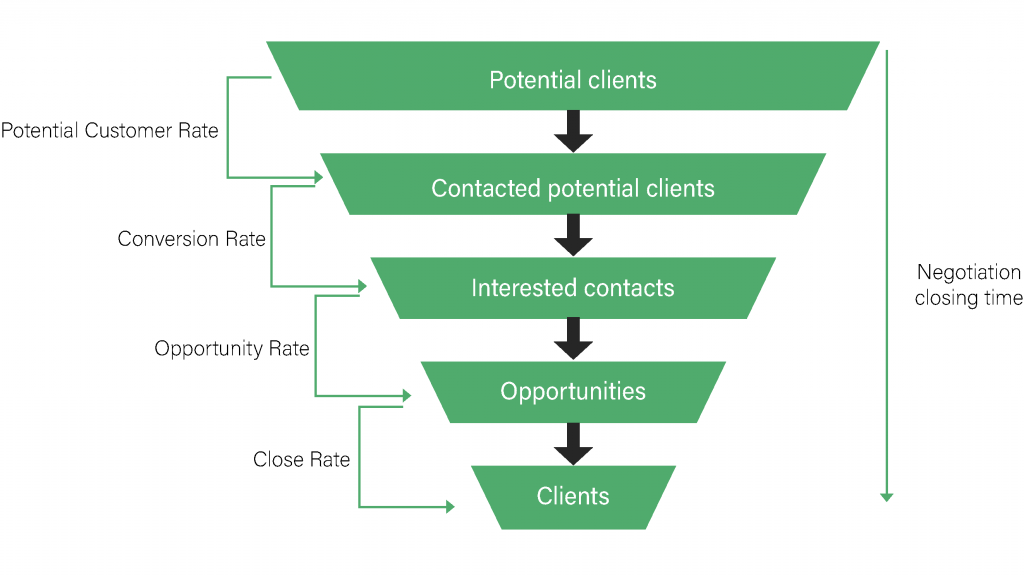
The sales funnel we have just described visually corresponds to an upside-down funnel. Thanks to this representation, it is possible to immediately identify the most efficient steps and also the most critical ones: from the first contact with a vast number of potential customers until the closing of the deal with the most qualified opportunities.
With steps, we mean the change of status of the contacts from a funnel phase to the following one.
- Potential Customer Rate: this KPI represents the capability to map the reference market and select the most important contacts. This figure allows us to understand the market potential and the resulting companies that we have to contact. These companies could be the totality or, more conceivably, only a part of the starting number.
- Conversion Rate: this index identifies the passage from contacted potential clients to interested contacts. It is the percentage of the reached companies that have given positive feedback or shown interest in the total number of the companies contacted.
- Opportunity Rate: this KPI represents the transition from interested contacts to opportunities, so those contacts to whom we have sent an offer / a quote or with whom we have had a meeting.
- Close Rate: Close Rate identifies the negotiations closing rate, and it is, therefore, the passage from opportunities to clients.
Furthermore, to carry out a complete analysis of the sales funnel, it is advisable also to consider the time factor.
- Negotiation closing time: time frame between the first contact with a potential customer and its acquisition.
Sales funnel as an adaptive element
We have just described the standard structure of the sales funnel: the starting model to create a specific and custom funnel for every company. Sales funnel can indeed be constructed, analyzed, and elaborated in different ways depending on the characteristics of each company. Here in Vehnta, we build it in this way, then define it as an adaptive element: a tool that we can recreate, adapting it to every customer’s features and objectives to optimize sales performances.
Case study
To better explain the potential that the construction, the analysis, and the elaboration of the sales funnel offer, below is an example of the optimization of a sales funnel.
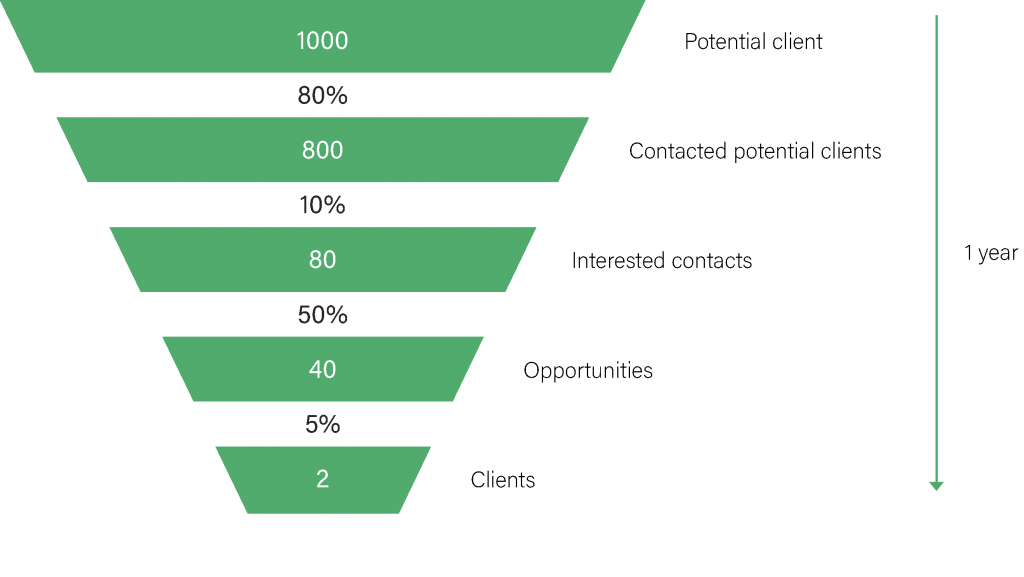
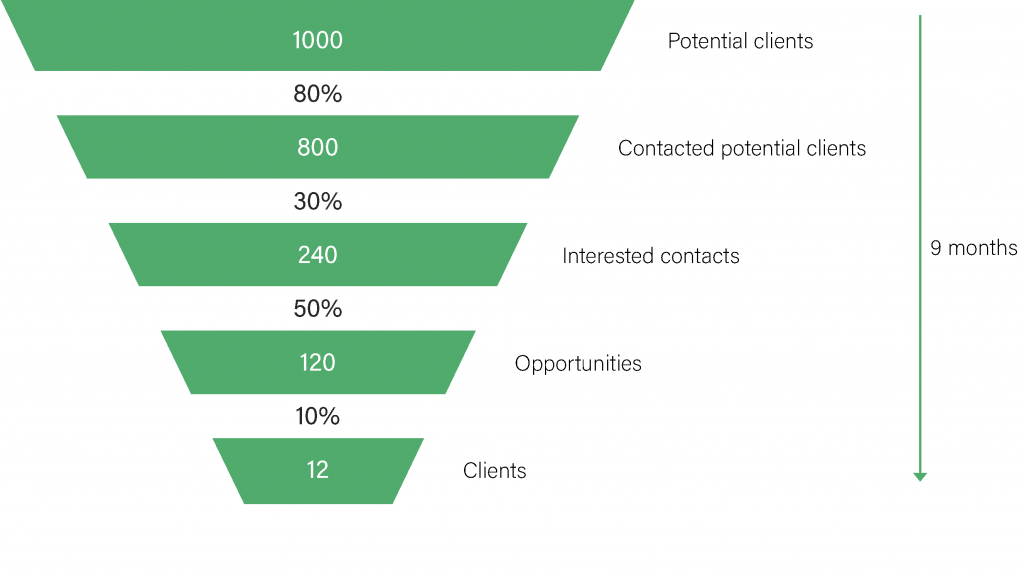
As you can see from the funnel, the company of this case study has been extremely efficient at mapping and contacting potential customers for its product or service: based on 1000 potential clients, it has reached 80%. Therefore, the first step, which starts from the total number of potential customers to selecting a more restricted number of contacted potential customers, is efficient.
The passage from contacted potential customers to interested customers seems instead a critical aspect: the percentage is 10%.
The transition from interested clients to opportunities is instead positive: it seems that the company’s sales managers, once they have engaged a potential customer, are able to start a negotiation that could bear fruit.
Lastly, a closing rate of 5% is the less positive figure, indeed the most delicate topic that requires greater attention.
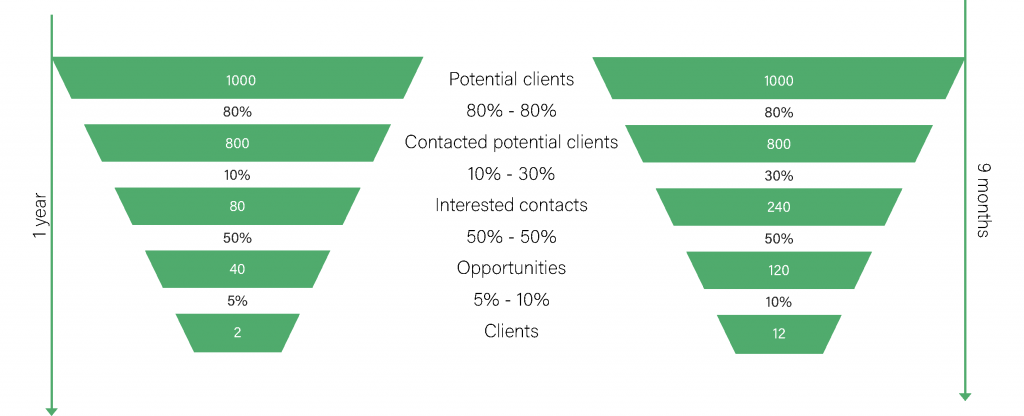
Starting from this funnel, it is already possible to highlight the most critical steps: in this case, they are Conversion Rate and Close Rate. Specifically, working on these KPIs helps to optimize the funnel and achieve a result like the following one:
After having analyzed the funnel data, it is indeed possible to start with the elaboration phase and change the shape of the funnel and the related conversion rates from one status to the other one while at the same time achieving a reduction of the negotiation closing time.
Focusing on the less efficient steps and analyzing the related data makes it possible to implement actions to improve general sales performances and optimize each passage precisely. In order to obtain an optimization like the one we have shown in this case study here in Vehnta, we operate by analyzing strategic objectives and by integrating digital tools able to optimize the whole process of generation of opportunities, by widening the scope and reducing the time for customer acquisition.
Even if an optimally standardized funnel does not exist because each company differs from the others and moves in different markets, there are ways to improve the performance of each step, just like in any analysis. Therefore, it is necessary to start from a snapshot of the current situation to undertake optimization actions and thus create a higher commercial value.
Choosing an approach like the one we suggest states the will to improve the present situation. As shown in this post, starting from the snapshot of the factual reality, it is possible to define actions to improve the business process and consider the peculiarities of the business and the market.
Increase of ROI
Let’s now try to move from percentages to absolute numbers. Assuming that the average price of the offers is €100.000, the starting sales funnel included two closed negotiations for a total of €200.000. In contrast, the new funnel has 12 positively closed negotiations and, therefore, still considering the average value, a new total of sales of €1.200.000.
Furthermore, as previously mentioned, the improvement of sales performance and the use of the digital tool has also determined a reduction of negotiation closing time. This outcome allows us to positively close a more significant number of negotiations in a more limited period and contributes to increasing ROI.
Would you like to know more? Contact us by filling in the following form to tell us about your sales objectives.