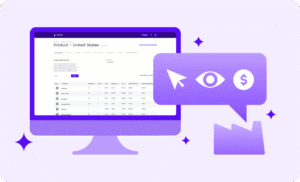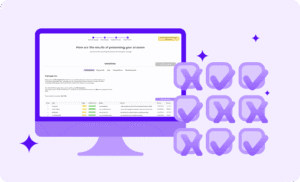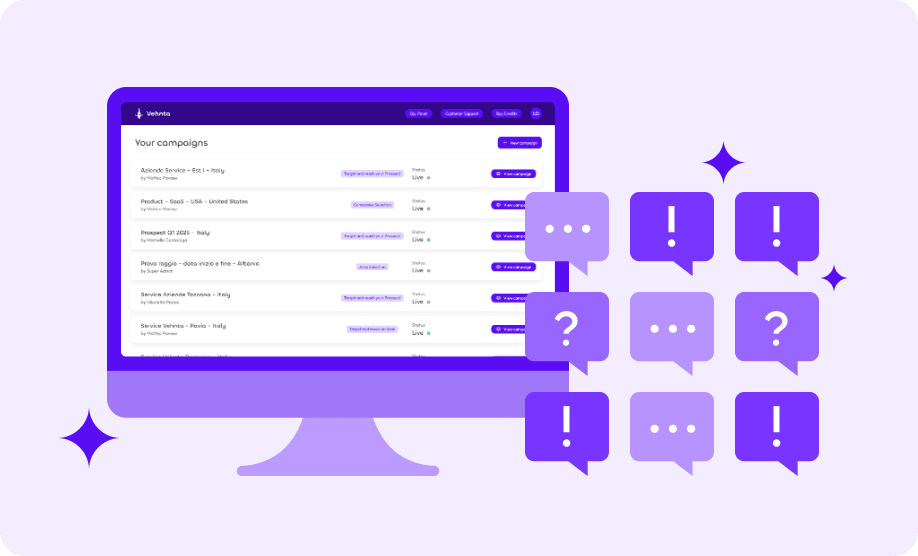
The Vehnta dashboard is designed to give you organized, granular, and actionable insights on your B2B campaigns, better and faster than Google Ads alone.
You can review metrics and drill down by company, branch, search terms, and other important dimensions.
1. Target Companies Tab
Purpose: View all target companies (or areas) and their aggregated performance at a glance.
Default Metrics Displayed:
- Companies
- Impressions
- Clicks
- CTR (Click-Through Rate)
- Average CPC
- Cost
- Search Click Share
- Search Impression Share
How to Use:
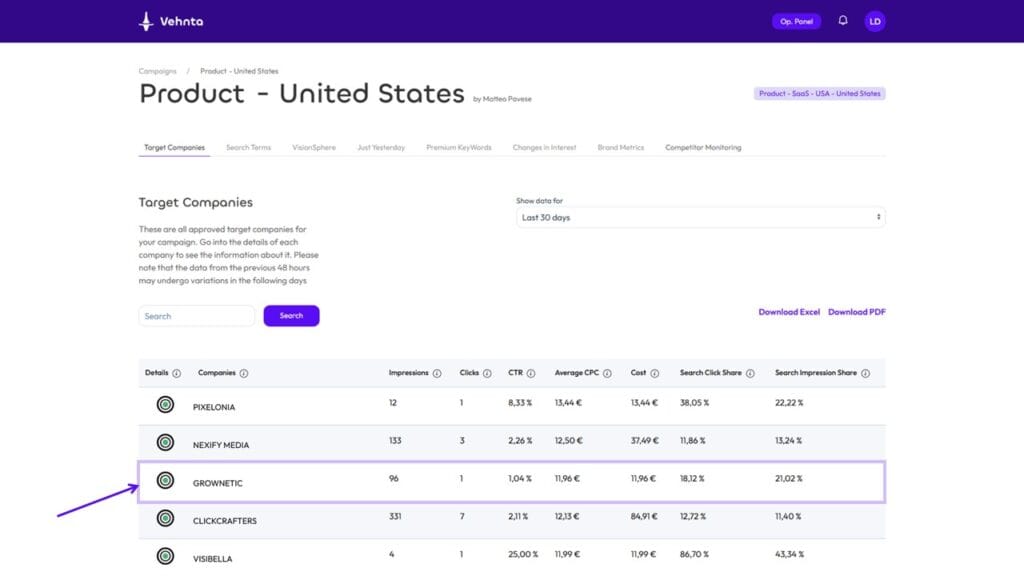
- Sort companies by any metric to quickly identify top-performing targets.
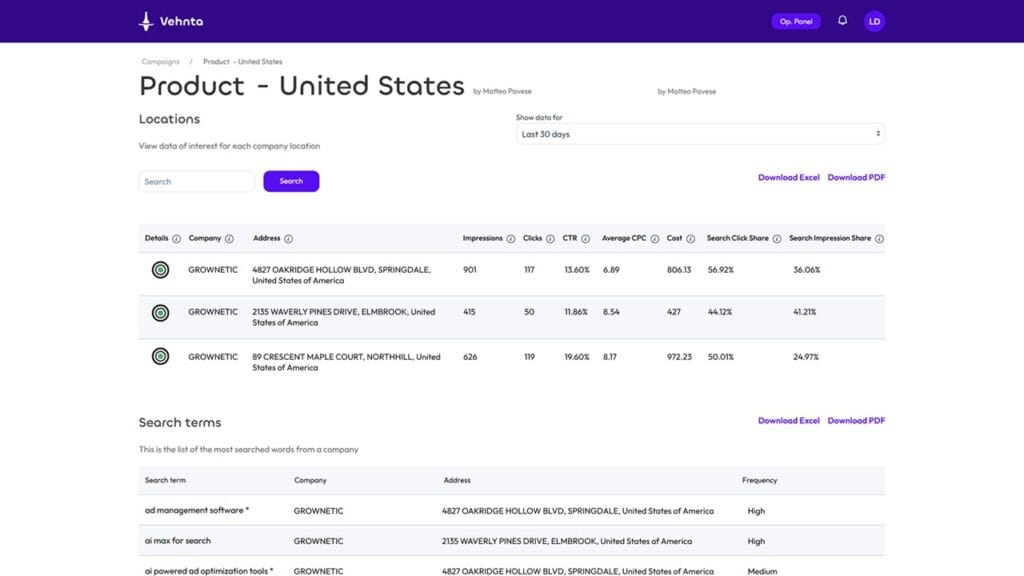
- Click “Details” next to a company to view performance of individual branches.
- Select a branch to see:
- Branch-level performance
- Search terms that triggered ads for that specific branch
Tips:
- Customize the view with additional Google Ads metrics relevant to your campaigns.
- Use this tab to prioritize follow-ups with high-performing or high-cost companies.
2. Search Terms Tab
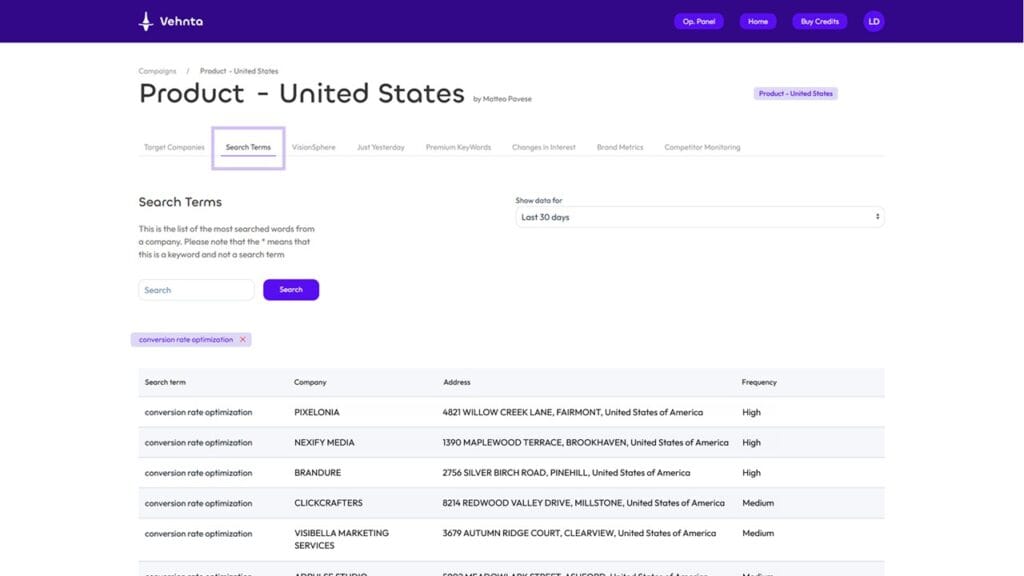
Purpose: Understand what your target companies are searching for.
Features:
- Lists search terms in order of frequency.
- Clicking a term shows:
- Which companies searched it
- From which branch/location
- How often it was searched
Use Cases:
- Discover which topics and keywords resonate most with your target companies.
- Align sales and marketing messages with actual search behavior.
- Identify SEO opportunities and optimize landing pages based on real search queries.
3. Visionsphere Tab
Purpose: Identify most active companies based on behavioral signals.
How it Works:
- Vehnta assigns a score per company based on multiple parameters: searches, clicks, website visits, etc.
- If a company’s score exceeds its baseline, you receive an email notification.
Tip:
- Time to act! This is your real-time signal to engage prospects showing increased interest.
- Use this for ABM prioritization and lead outreach.
4. Premium Keywords Tab
Purpose: Track your most important keywords (brand, key competitors, product names).
Features:
- Shows who searched, where, and when.
- Optional notifications for spikes in searches.
- Dashboard display can be shared with sales teams to prioritize outreach.
Use Cases:
- Focus your sales efforts on the companies showing interest in your brand or product.
- Monitor competitor mentions to adjust campaigns or marketing strategies.
5. Changes in Interest Tab
Purpose: Track companies that have spikes in interest for your keywords.
Use Cases:
- Identify emerging opportunities before competitors do.
- Understand trends in how companies engage with your industry or products.
- Feed insights directly into sales outreach or retargeting campaigns.
6. Brand Metrics & Competitor Monitoring
Purpose: Two sides of the same coin:
- Brand Metrics: Who is searching for your brand
- Competitor Monitoring: Who is searching for competitor brands
Benefits:
- See which branches or companies are engaging with your brand vs competitors.
- Allows quick identification of prospects for follow-up or targeted campaigns.
- Perfect for accounts with large target lists, avoiding the need for deep, manual analysis.
Tip:
- Combine with Visionsphere and Premium Keywords for a 360° view of interest and intent.
Dashboard Usage Tips
- Start with Target Companies – Identify top-performing companies and branches.
- Drill into Search Terms – Understand what drives clicks and interest.
- Monitor Visionsphere Scores – Take immediate action on companies showing increased activity.
- Leverage Premium Keywords – Align sales and marketing priorities with real-time data.
- Use Brand & Competitor Metrics – Monitor market share and competitor engagement.
- Custom Views – Tailor dashboard metrics to your KPIs for quick reporting and sharing with stakeholders.
This dashboard setup allows fast, granular insights into B2B campaigns, enabling your team to focus on high-potential companies and branches, act on interest spikes, and make data-driven decisions without manual digging in Google Ads.